Close
Type at least 1 character to search
Back to top

Improving

Quick Decision Clarity for Accountability Partners

Behavioral experimentation to reduce cognitive load, help accountability partners assess risk, and take action with confidence. 

The report summary module in the Victory App

Who I Worked With

Jerad Raines (Product Designer, Co-Researcher)

My Role

UX Researcher (Primary)

Research METHODOLOGY

Experiments

Quantitative Survey 

Tools Used

UserTesting
Alchemer
Miro
Sketch
Confluence
Microsoft Excel
SPSS

The Company

Covenant Eyes: Behavior Change Through Accountability

Covenant Eyes is a SASS company focused on helping customers change their online behavior. For over 20 years, Covenant Eyes has been a pioneer in leveraging AI-driven technology to facilitate human-to-human accountability as a core behavior change technique.

Their product combines AI monitoring with regular accountability reports, sent to trusted accountability partners (not provided through Covenant Eyes). The goal of this intervention is to support behavioral change through social reinforcement and self-regulation.

The Challenge

Helping Accountability Partners Make Faster, Clearer Decisions

Accountability partners play a crucial role in Covenant Eyes’ behavior change intervention by reviewing internet activity reports, providing feedback, and offering support to customers.

People have limited mental bandwidth when reviewing information, especially in emotionally sensitive situations like accountability reports. Past user research revealed a persistent behavioral problem: accountability partners struggled to interpret the reports and couldn’t easily answer the critical question: “Should I be concerned?” This lack of clarity led to decision fatigue and ineffective follow-up conversations.

The specific questions accountability partners wanted answered were:

  • Should I be concerned?
  • What should I be concerned about? 
  • How should I approach this conversation?

The goal of this project was to conduct a series of experiments to identify the most effective design for improving accountability partners' decision clarity, reducing cognitive effort, and supporting faster, more confident decisions.

I worked in close collaboration with a product designer throughout this project, including co-designing the experiments.

RESEARCH PROCESS

Experiment 1

Experiment 1

Evaluating Solutions to Improve Accountability Decision Making

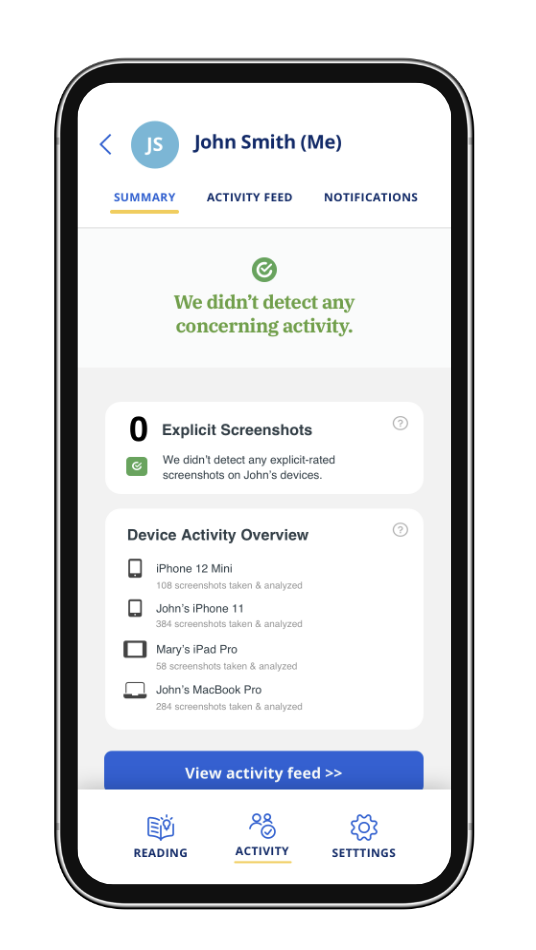
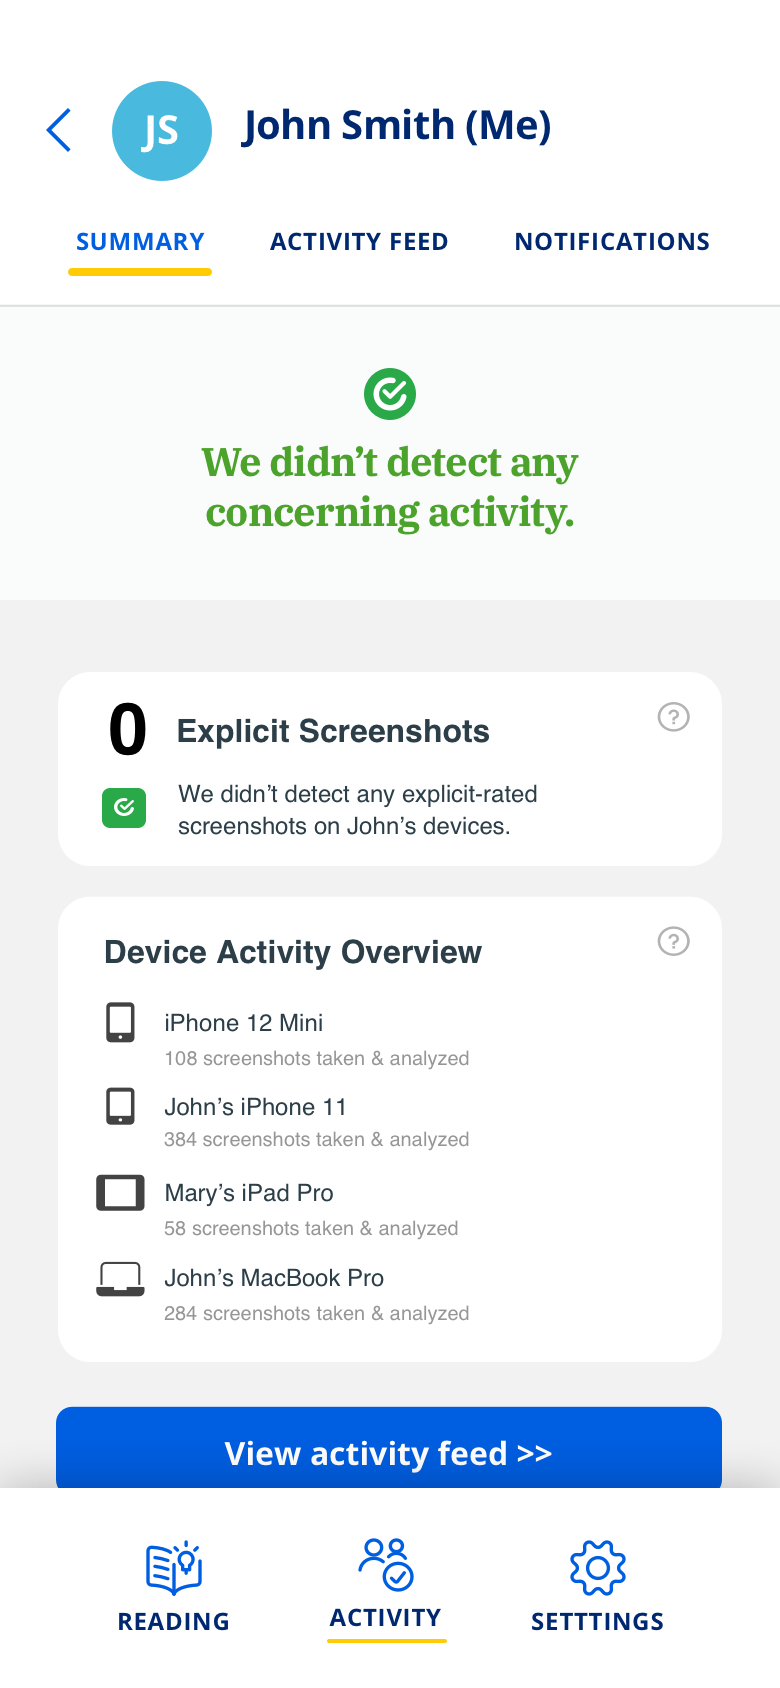
To address this challenge, a Covenant Eyes' UX designer created the Report Summary Module, a feature designed to sit at the top of each accountability report email. Its purpose was to reduce cognitive effort and minimize decision fatigue by helping accountability partners quickly and accurately assess whether or not he/she should be concerned about the customer's recent internet activity.

The goal of this behavioral experiment was to evaluate the effectiveness of two different Summary Module design concepts compared to the current report format. We hypothesized that adding a Summary Module would improve decision accuracy and reduce the cognitive effort required to review reports, principles closely tied to cognitive load reduction and salience in behavioral economics.   

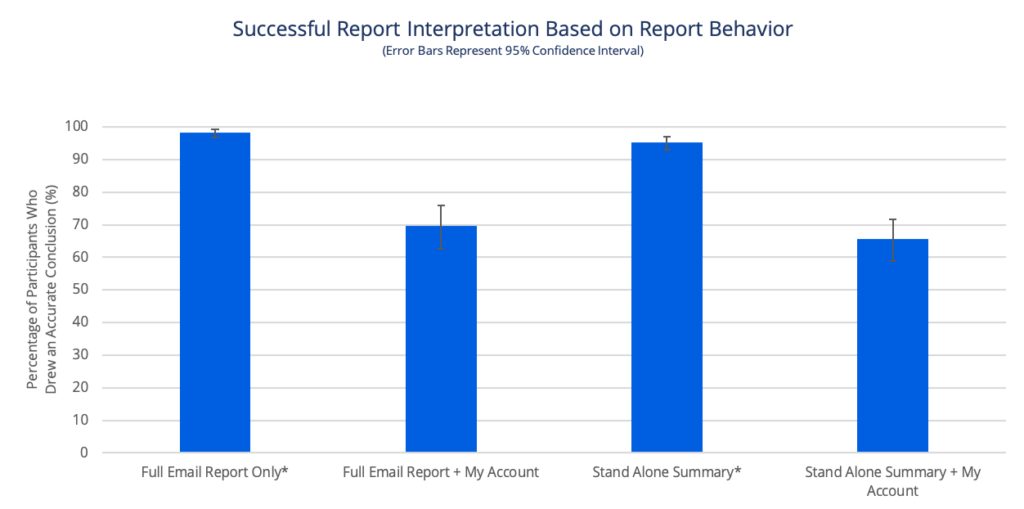
The UX designer and I collaboratively planned and executed the experiment on the UserTesting platform. Together, we designed the study to systematically compare three report designs (two new concepts and the existing version). Each accountability partner who participated in the study engaged with one of the three design concepts and was asked to assess whether they should be concerned or not about the customer's activity. To isolate decision performance, all reports shown in this study were non-concerning scenarios.

I analyzed both behavioral and attitudinal outcomes, including: 

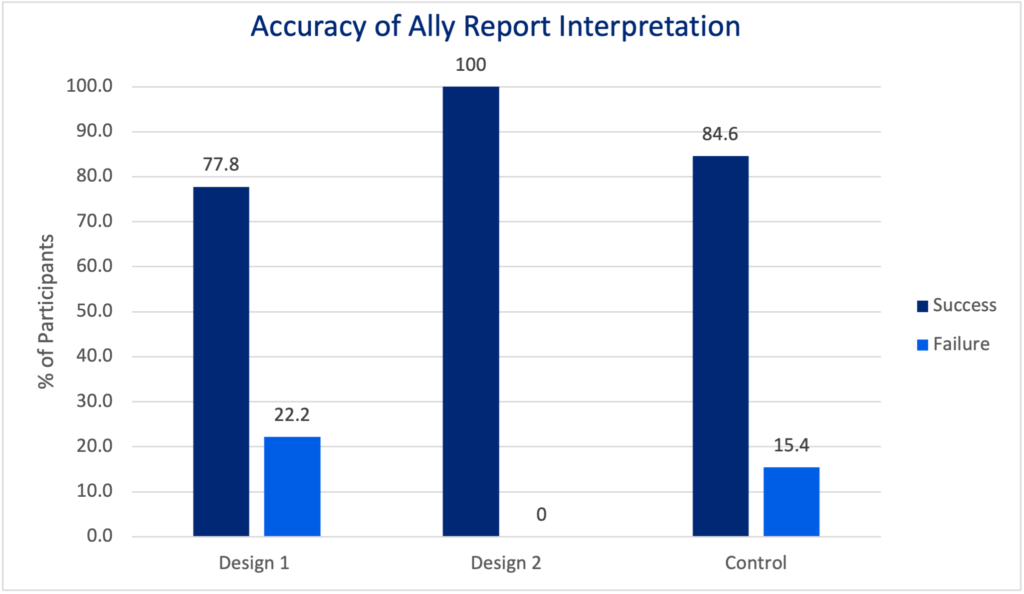
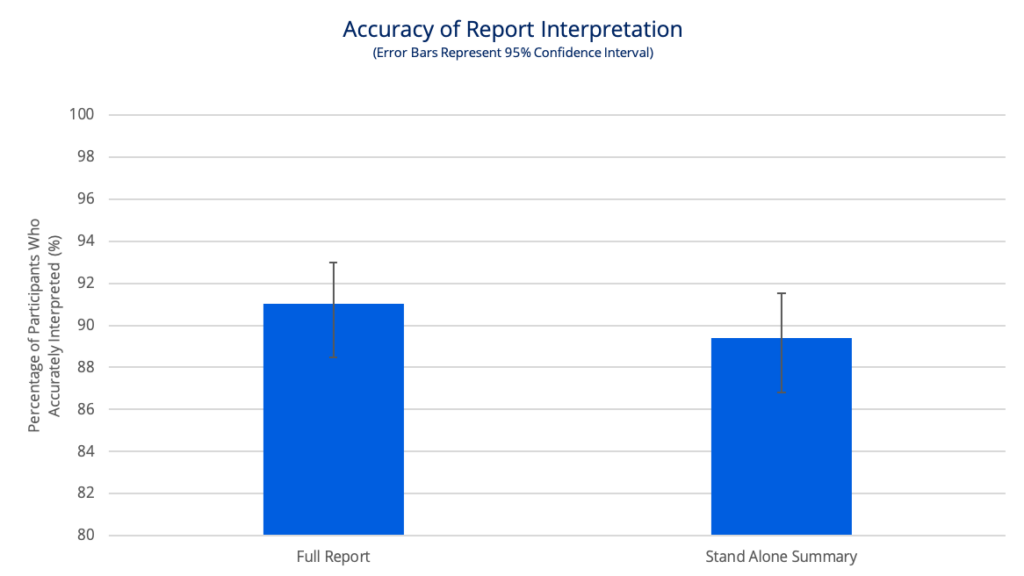
  • Decision Accuracy: Did participants correctly assess that there was no concerning activity? 
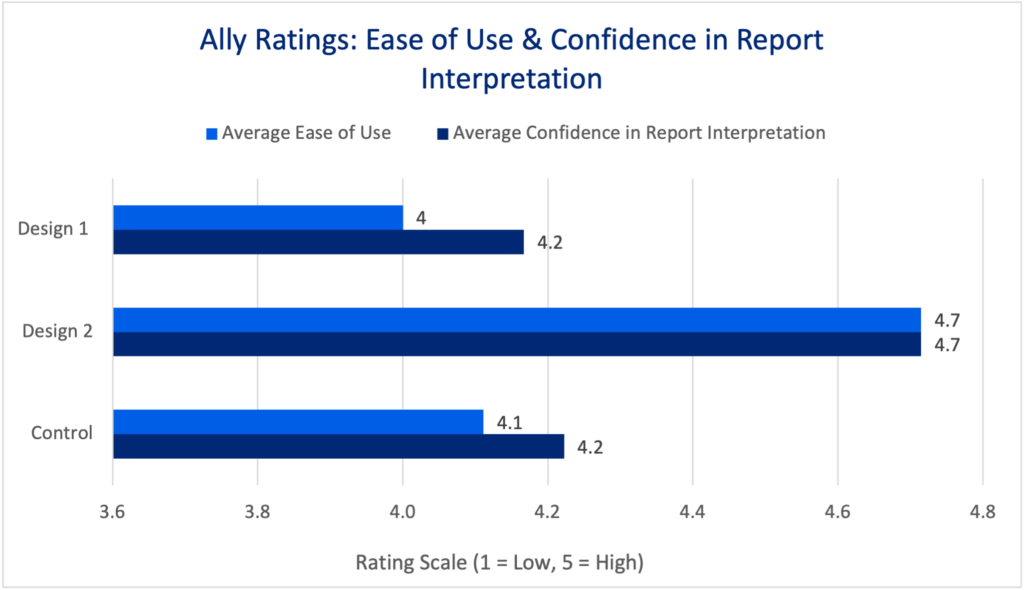
  • Decision Confidence: How confident were they in their assessment? 
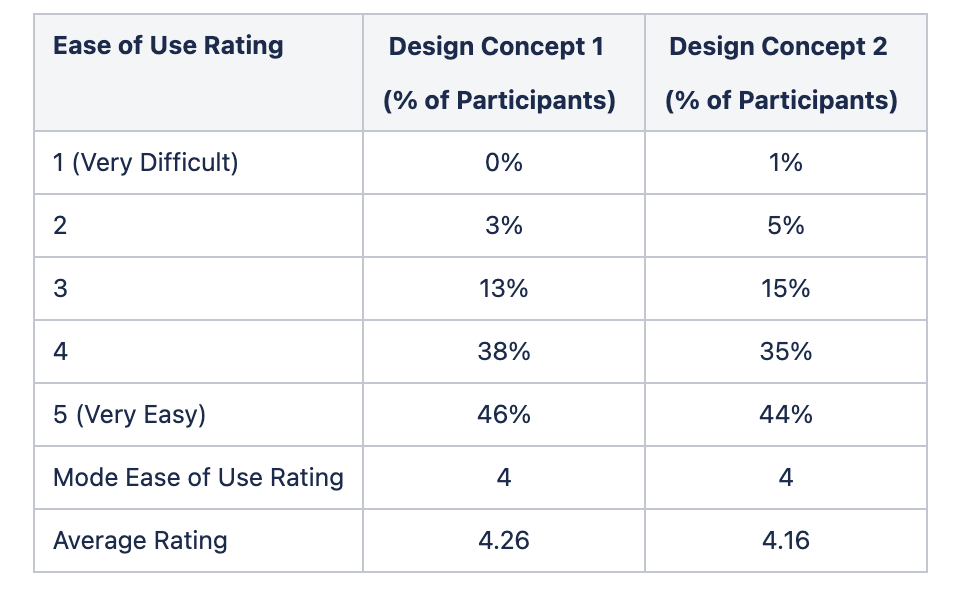
  • Perceived Effort: How easy or difficult was it to complete the task? 
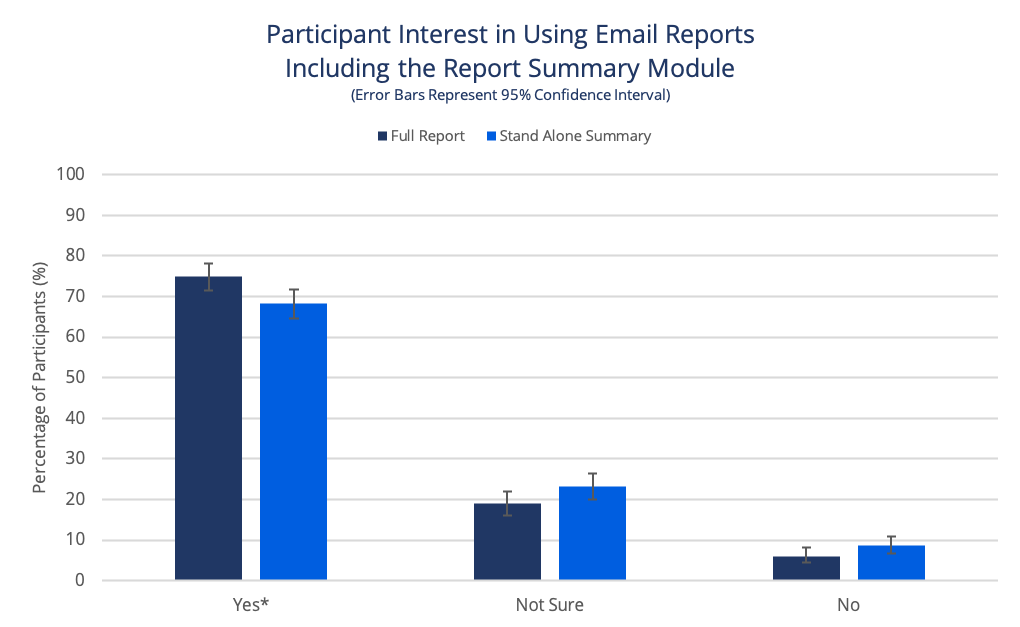
  • User Feedback: Qualitative input on usability and pain points

This approach allowed us to evaluate the behavioral impact of each design on decision clarity, effort, and user confidence.

A report concept tested with accountability partners

Descriptive Statistics & Affinity Diagramming

Insights on Decision Clarity, Cognitive Effort, and Trust

A total of 28 Covenant Eyes accountability partners participated in the experiment, testing the two new Report Summary Module Designs and the existing control. The analysis followed a structured approach: 

  1. I began by analyzing the quantitative data with descriptive statistics to assess baseline concept performance.
  2. I then ran inferential statistics to determine whether the findings were representative of the larger accountability partner population. 
  3. Finally, the product designer and I collaboratively analyzed the qualitative feedback using an affinity diagram in Miro to uncover deeper behavioral insights.
This graph shows that Design 2 performed best for user accuracy interpreting the report compared to Design 1 and the Control

High Decision Accuracy Across All Designs

Across all three designs, accountability partners correctly assessed that no concerning activity was present (Chi-Square Test, p=0.7778). However, some participants noted difficulty in evaluating reports due to small image sizes and high blur levels. This highlights how visual clarity and cognitive effort still played a role in their decision process.


No Differences in Ease of Use or Decision Confidence

During each test, accountability partners were asked to rate (1) the design's ease of use and (2) their confidence in making an accurate decision.

Statistical tests (Krusal-Wallis) confirmed there were no significant differences in either confidence (p=0.202) or ease of use (p=0.116). I selected this test because of the data's non-normal distribution and ordinal scale.

While accuracy remained high, these findings suggest that perceived cognitive effort and self-reported confidence were relatively stable across designs in this test. However, subtle differences in effort minimization could still exist at a behavioral level.

This graph shows that users rated Design 2 as easier to use than Design 1 or the Control

The New Feature Provided Value

Despite similar performance across conditions, participants responded positively to the concept of the Summary Module. Many cited the value of having a clear, upfront summary to reduce the mental effort of scanning detailed reports, reflecting the behavioral economics principle of salience (making key information immediately noticeable) and effort minimization.

Participant comments emphasized this point:

  • “It’s really nice that it tells you that it didn’t detect activity to be concerned about right at the start.”
  • “The summary is nice because it gives you an overview of everything.”

Overall, interest in the new feature was high. The majority of participants were interested in using a Report Summary Module, with an additional 18% indicating they would use it once remediations were made. This suggested the Summary Module could provide value to accountability partners reviewing reports. In fact, 24% of participants who tested the new feature viewed the summary module as the most important feature in the report.

Even in the control group (who did not see the summary module), participants expressed a desire for this type of decision support:

  • “I would like something more clear if I should be concerned or not.”
  • “It would of course be nice to have a list of summary or warning about what happened…The recap is not enough. It’d like it to say at the top of the screen that nothing is wrong.”
  • “It would be nice to have a summary instead of looking at the screenshots. It stresses me out.”

These comments further validated the behavioral value of reducing decision fatigue and increasing information salience through summary tools.

Designing for Trust

Participants diverged in their level of trust and reliance on the Summary module. 

  • Some accountability partners fully trusted the summary module data, skipping the additional review. This minimized effort.
  • Others still reviewed screenshots despite the summary, citing concerns about the AI’s past errors. AI accuracy had been a user concern in previous user research.

Trust plays a critical role in the success of automated decision aids. 


DESIGN REFINEMENT

UX Design Sprint

Data-Informed Adjustments to Reduce Cognitive Load

Insights from the initial behavioral experiment revealed small but meaningful opportunities to further reduce decision fatigue and increase salience.

The product designer and I collaborated closely to address these findings through targeted design updates. We focused on three key areas:

  1. Content Clarity & Consolidation: Simplifying text and combining related sections to reduce information overload and minimize scrolling.
  2. Content Reordering: Placing the most critical, high-salience information at the top of the report to ensure faster, more confident decision-making.
  3. Visual Design Refinements: Adjusting layout and visual hierarchy to make reports easier to scan and process, lowering the effort required to navigate the report.

These refinements were grounded in user feedback and behavior observations from the first experiment.


Experiment 2

Experiment 2

Scaling the Experiment: Testing Solution Effectiveness at Scale

Following the initial behavioral experiment, we designed a second, larger-scale behavioral study to validate and extend our findings with a broader audience to get buy-in from leadership.

In this experiment, we shifted to a quantitative survey format, testing the refined designs with a significantly larger sample of Covenant Eyes accountability partners. We also explored whether simplifying the email report (by shortening its Recap of Activity section) would still meet accountability partners’ needs. The goal was to determine whether reducing report length could further decrease cognitive load without sacrificing decision clarity or confidence.

This experiment also opened the door to exploring how the email report and other communication channels, such as the My Account dashboard, might work together to provide layered information (i.e., progressive disclosure).

Plus mobile device
Final Concept of the Report Summary Module that was built into the product

Statistics & Affinity Diagramming

Key Findings to Inform Confident Business Decisions

A total of 1,295 current accountability partners completed the survey, with participants randomly assigned to test one of two design concepts:  

  • Both concepts included the new Report Summary Module at the top of the email report.
  • The key difference: Design Concept 2 featured a significantly shorter Recap of Activity section, requiring users to visit My Account for detailed information if needed.

This experimental design allowed us to isolate whether the shorter, streamlined report would impact decision quality, cognitive effort, or trust in the report.

As with our earlier experiment, we analyzed both behavioral and attitudinal data, using descriptive statistics alongside a 15,000 sticky note affinity diagram to surface deeper user insights.

High Decision Accuracy and Confidence Across Designs

Similar to Experiment 1, accountability partners were asked to use an email report to determine whether or not to be concerned about a person's internet activity. If needed, they were also given the option to visit My Account to view more screenshots.

The graph shows that survey respondents' conclusions, using either design concept, were accurate ~90% of the time. There wasn’t a statistically significant difference between the groups (p=0.985). 

This reinforced that accountability partners could reliably assess reports, even when the Recap of Activity section was shortened.

Graph showing users drew an accurate conclusion with high accuracy using either design concept.
Ease of use rating percentages

Design Concepts Minimized Cognitive Effort

Participants rated both designs as easy to use and reported high confidence in their decisions. Many participants described the Report Summary Module as reducing their stress and making the review process faster, which directly reflected behavioral economics concepts of effort minimization and salience:

  • The summary helped them quickly reach a decision.
  • They appreciated having an easy, upfront answer with the option to dig deeper if desired.

The Shortened Report was Just an Effective as the Full Report

Approximately 70% of participants in each group only used the email report to make their decision. In fact, accountability partners who only looked at the email report to make a decision showed higher decision accuracy. These findings suggest that a shorter report could effectively meet accountability partners’ needs while reducing information overload.

The majority of participants, regardless of the design, didn't need any additional information

Chi-Squared Test of Independence did not find an association between design and next behavior (p=0.225).

Participants who only drew a conclusion from the email report did so with significantly higher accuracy than those who reviewed additional information

Z Test for Proportions found a significant difference between report viewing behavior and accuracy for each design.

Strong Demand for the Summary Module

Experiment 2 also validated high user interest in adopting the Summary Module. Many participants expressed that the summary made reports easier to review, with clear visual cues and streamlined content that supported quick, confident decisions.

This interest also reflects a baseline level of trust in the summary as a decision-support tool (either as a primary source or as a helpful first step before deeper review).

Note: Users who chose to opt out cited unrelated service concerns or desired additional design tweaks.

Significant interest in the report summary module being added to the email reports sent to accountability partners

Chi Squared Test of Independence detected an association between design and choice to opt in (p=0.022). Using a post hoc test, Z Test for Proportions found significant differences between ‘Yes and Not Sure’ and ‘Yes and No Choices.’ 

CONCLUSION

These experiments demonstrated the power of behavioral design to reduce decision fatigue and cognitive effort while preserving user confidence and accuracy. The Report Summary Module effectively helped users quickly evaluate accountability reports and make accurate decisions, whether they relied solely on the summary or used it as a starting point before deeper review.

In both experiments, Covenant Eyes' accountability partners saw clear value in the Report Summary Module, considering it one of the most important features of the report. It was described as a time-saver that simplified decision-making.

These studies also revealed a broader behavioral insight: trust in the Report Summary Module played a crucial role in its success. By showing a strong willingness to use the summary, either as their main decision tool or as a supporting aid, accountability partners demonstrated confidence in the feature’s reliability. This trust enabled the summary to serve as a behavioral shortcut, reducing decision fatigue and improving both speed and accuracy.

Findings from Experiment 2 also suggested that shortening the email reports didn’t introduce negative consequences, opening future opportunities to rethink how email reports and additional communication channels work together using progressive disclosure to support accountability partners’ decision-making behavior.

Broader Implications

Insights from these research studies were used to develop a pitch for building the Report Summary module. Although the pitch did not move forward at the time of submission, the Summary Module was later built as a core feature into Covenant Eyes' new Victory App, designed exclusively for accountability partners.

The Report Summary Module continues to be iterated upon to provide greater value to accountability partners. 

Skip to content